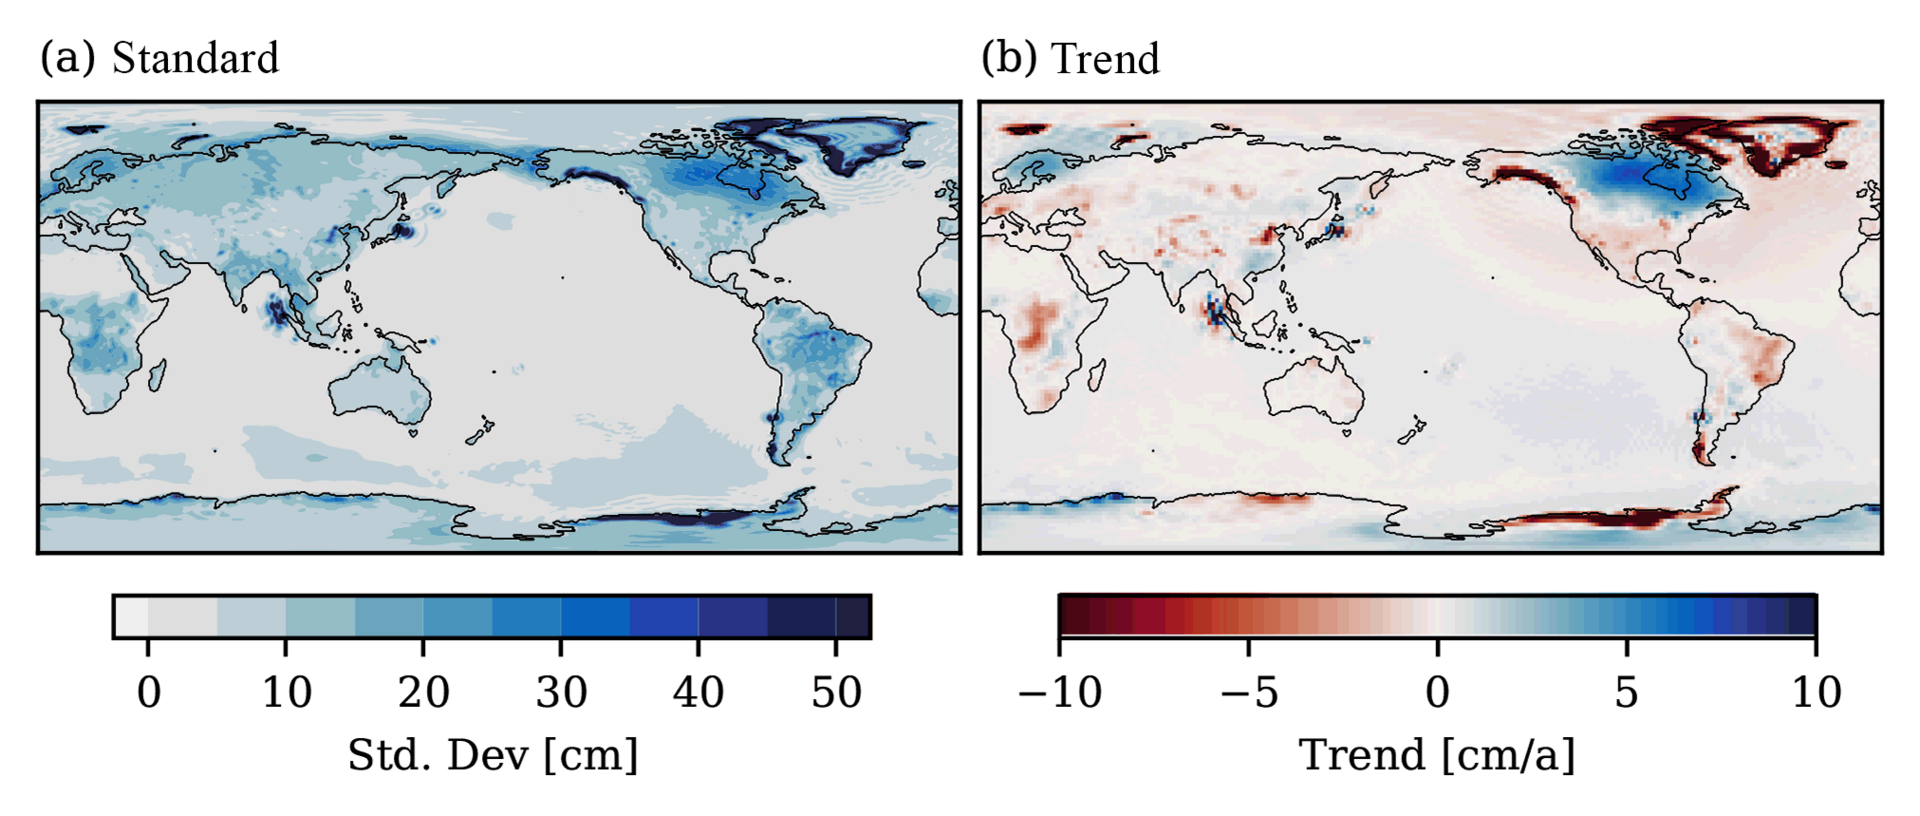
In order to prepare future satellite gravimetry missions, dedicated end-to-end simulation studies are needed to gauge the prospective mission performance. They allow the assessment of mission concept capabilities and can be used to prepare processing strategies, but require a model of the mass variations in the Earth system that is representable and includes appropriate target signals. The model commonly used as input for these simulations is the ESA Earth System model, which has now been updated to version 3.0 is ready to be used for simulations of, e.g., GRACE-C, NGGM, and the MAGIC constellation.
Text: Dr. Linus Shihora, GFZ Helmholtz-Centre for Geosciences
The development of future satellite gravimetry missions such as the MAGIC constellation require, among many other steps, simulations of the entire mission performance and the geodetic data processing chain. That includes the simulation of the satellite orbits, the individual sensor measurements, the gravity field processing, and in the end the inversion of surface mass anomalies. One of the main inputs to these simulations is a model that represents the variations in the Earth system which are either target signals or sources of noise. For satellite gravimetry simulations, the commonly used basis for such simulations is the ESA Earth System Model (ESA ESM).
Given the increased capabilities of these new satellite missions, simulations, and by consequence the ESA ESM, have to include adequate target signals which may not have been accessible through current measurements. For that purpose, a new version of the ESA ESM has been developed that updates and improves upon its predecessor in a variety of ways.
The ESA ESM is structured in individual layers that each represent a certain component of the Earth system. These layers include the atmosphere (A), ocean (O), terrestrial water storage (H), ice sheets and glaciers (I), the solid Earth (S), the sea-level (B), earthquakes (E) and a combination of regional signals related to the Atlantic Meridional Overturning Circulation (AMOC) and deposition of sediments from river basins in the ocean (D).
The mass variations in the atmospheric layer are based on reanalysis data from the European Centre for Medium-Range Weather Forecasts (ECMWF), i.e. an atmospheric model that is routinely combined with large amounts of meteorological observations to create the best representation of the atmosphere on time-scales from hours to decades. The atmospheric data is then also used as input for simulations of the ocean and land surface dynamics using the Max-Planck-Institute for Meteorology Ocean Model (MPIOM) and the OS LISFLOOD model by the Joint Research Center (JRC) of the European Commission, respectively. Especially for the hydrology, the newly embedded OS LISFLOOD means a better representation of e.g. extreme flooding events and the inclusion of anthropogenic groundwater abstraction which are valuable target signals for future satellite missions.
Variations in the cryosphere are represented as mass changes in the Antarctic and Greenland ice-sheets, nine regional high-mountain glacier systems in Europe, Asia and North and South America, as well as the very small trend signals due to permafrost thawing in the Arctic.
One of the main signal sources of the solid Earth is the still ongoing uplift of the upper mantle due to the deformation of the last glacial maximum, a process known as glacial isostatic adjustment (GIA). In addition, the ESM also provides the smaller trend signals of the solid Earth induced by the Little Ice Age (LIA). In both cases, the signals are simulated with dedicated runs of the VILMA model.
Related to the solid Earth signals, although in a separate layer, the new ESM greatly extends the range of earthquake signals. Apart from the large ruptures such as the Sumatra-Andaman and Tohoku-Oki events, the ensemble includes a variety of earthquakes down to magnitude 7.7, including the recent 2023 Kahramanmaras rupture. While somewhat artificial, all events are time-shifted towards the beginning of the ESA ESM time-series, mostly in 2008, in order to allow for a long representation of the post-seismic deformations associated with the stress changes induced by the seismic events.
Many of the mass variations in the layers of the ESM involve discharge of water into the oceans; a process that is not considered in the ocean layer of the ESM. Instead, the change in the ocean mass and the corresponding sea-level change are included as a separate layer which balances the mass variations over the continents from the atmosphere, hydrology, and cryosphere. However, the mass sea-level change is not spatially uniform. Regional changes occur through the change in the rotation of the Earth, sea-floor deformations, as well as changes in the gravitation which combined result in spatially heterogeneous sea-level fingerprints.
Lastly, the new ESM version considers much smaller regional mass anomalies as possible targets for future missions. This includes changes in ocean bottom pressure caused by deep ocean transports associated with the Atlantic Meridional Overturning Circulation, which plays a major role in the global ocean circulation and climate system. While the overturning of water masses itself is not detectable through satellite gravimetry missions, there are small pressure variations along the western side of the Atlantic which can be used to infer changes in the AMOC. Additionally, the deposition of sediments which are eroded over river basins and subsequently transported into the oceans create small mass trends when they are deposited. Since there are few in-situ observations mapping these depositions globally, future gravity missions may help shed light on these processes and a first estimate of these trend signals is now newly included in the ESM.
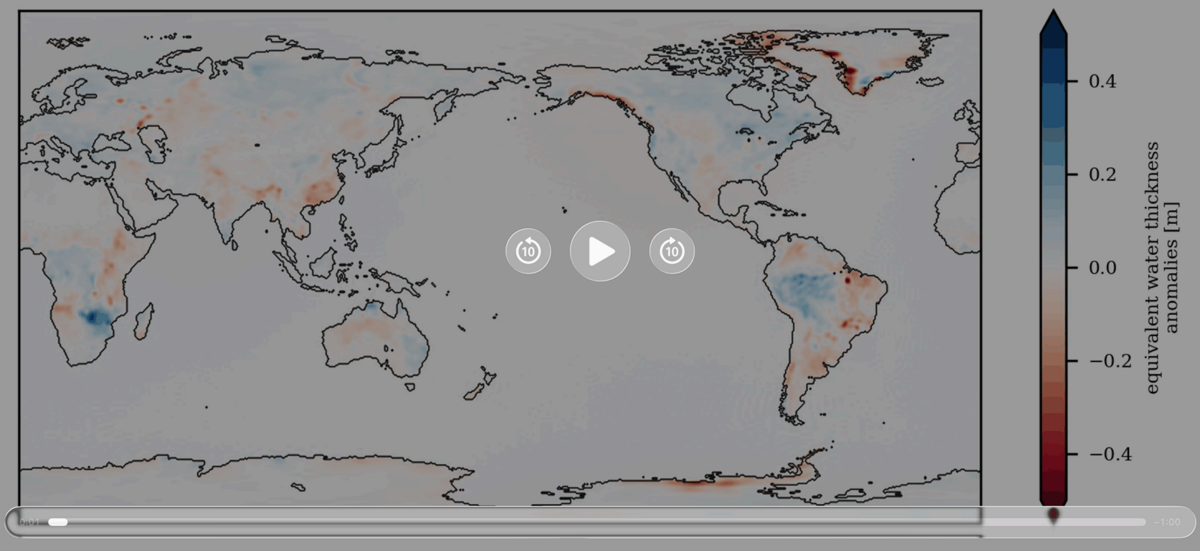
The animation below exemplarily shows time-variations in the final model. It shows the variations in the hydrology, ice sheets, solid Earth, sea-level, earthquakes and regional processes for the single year 2008 on daily time-scales. It even shows the included very brief tsunami signals following the Sumatra-Andaman and Tohoku-Oki ruptures in the middle of January and Febuary.
Animation
Together, all the layers of the ESM represent a comprehensive model of relevant signals for future satellite missions. While the assessments of the simulations are ongoing, the developed processing approaches will allow users to take full advantage of the new satellite observations once they become available.